
Professor Jonathan C. Roberts
Professor in Visualisation / Director of Impact and Engagement

Affiliations
Links
- https://www.bangor.ac.uk/computer-science-and-electronic-engineering/staff/jonathan-roberts/en
Personal page - http://@jcrbrts
Twitter - https://www.researchgate.net/profile/Jonathan_Roberts5
Researchgate profile - https://scholar.google.co.uk/citations?user=9EvuoDgAAAAJ&hl=en
Google Scholar - https://uk.linkedin.com/in/jonathan-c-roberts-2249177a
Linkedin
Overview
Jonathan C. Roberts is a professor in the School of Computer Science, Bangor University, UK., He was a lecturer (Kent 1999), Senior Lecturer (Kent 2004, Bangor 2007) and became a professor in 2015. His research is focused on data visualization, visual analytics, human computer interaction and computing pedagogy. He is interested in how to analyse, visualise and interact with data, and how to sketch designs and make appropriate designs. He is the creator of the Five Design-Sheet methodology, and author of the book Five Design-Sheets: Creative Design and Sketching for Computing and Visualisation, Springer Nature, June 2017. He focuses on heritage and archaeology, oceanography, pedagogy, and social networking domains, Prof Roberts’ hypothesis is that by displaying the data in several different ways, and allowing the user to highly interact with it, then the user gains a better understanding of their data.
He is the School Director for Impact and Engagement and in July 2019 started a weekly Research Engagement meetups (trebling the quantity of School news articles) and lead on Project Rainbow (continuity of learning activities, see http://csee.bangor.ac.uk/). Leads the Visualization, Data-Modelling and Graphics research group (VDMG). Is a member of the UK CPHC (Council of Professors and Heads of Computing), a member of Senate, sits on the CoESE Ethics and Governance Committee (2018-) and on the Research Degrees Committee (2018-20).
Research
Jonathan Roberts' research interests cover the areas of interactive data visualization and visual analytics. He is interested in investigating how humans interact with visual depictions, explore different scenarios, and present their results. This includes from making designs and sketching ideas, developing HCI applications, developing multi-sensory interfaces, to evaluating these interfaces.
Areas: Visual Analytics, data Visualization, Human Computer Interaction (HCI), Creative Computing, Sketching designs, Computing Teaching (esp. visualization and creativity); Multi-sensory perception.
Basic research: Interaction techniques; sketching; multiple-view techniques; coordination; alternative representations; multi-sensory visualization; visualization theory; learning analytics; novel technologies; sensemaking; usability; education and learning strategies; history trails; uncertainty; parallel coordinate plots.
Applied domains: Heritage; Oceanography; Social Media data; Visualization theory; Learning and Education.
He is PI at Bangor for Supercomputing Wales, and Bangor lead for the UKRI doctoral training centre: AIMLAC (AI, Machine Learning and Advanced Computing), which provides 4-year, fully funded PhD opportunities across the broad areas of particle physics and astronomy, biological and health, and mathematical and computer sciences, and is a collaboration between the universities of Aberystwyth, Bangor, Bristol, Cardiff and Swansea (lead).
Contact Info
BSc, PhD, PGCHE, MIEEE, MACM, M-EG, SFHEA
School of Computer Science,
Teaching and Supervision
Experienced teacher, and experienced in leading others in their teaching. Demonstrated by
- Award of Senior Fellow of the Higher Education Academy (2015)
- Director of Teaching & Learning (2007-2016)
- Deputy head of School (2014-2016)
I have supervised to completion (advised) 7 PhD students through their PhD and 5 MSc-R. Am currently supervising a further 3 PhD students. External examiner for 16 PhD students and 5 MPhil/MScR (research masters). I have been internal examination for a further 8 PhD students. And have chaired 7 PhD student examinations at Bangor University.
Current teaching:
ICP-3036 Computer Graphics Rendering (20 credits), since 2015
ICE-4124 Information Visualisation (20 credits), since 2019 (updated from ICP4142 since 2007)
ICE-2902 Design, Art, Creativity and Storytelling, since 2020
Previously
ICP2036 Computer Graphics 2 – Algorithms (10 credits)
ICP4142 Information Visualization (15 credits) 2007-2018
ICP4123 Technologies for Internet Systems (15 credits), 2007- 2015
ICP3123 Web technologies (10 credits), 2007- 2015
ICP3099, IED3098, IED3099 Convenor of all 3rd year project modules: (30 credits), 2007- 2011
ICP4145 Fundamentals of Computer Graphics (15 credits), 2007- 2011,
Postgraduate Project Opportunities
I am willing to supervise projects in a wide range of topics that covers my interests in data visualisation, creativity, modelling and AI. For instance, projects could cover interactive data visualization and visual analytics, creative computing, heritage visualisation or some aspects of Natural Language processing applied to visualisation. I collaborate with oceanographers, archaeologists and lingustic lexicographers, and so could supervise visualisation projects in these application areas. I lead the Visualisation, data Modelling and Graphics group, and my research students all program code, are computing focused, get involved with Eurograhics and the IEEE Visualisation conference, and we often publish in Eurographics and IEEE Transactions on Visualisation and Computer Graphics. I am interested in researching how humans interact with visual depictions, explore different scenarios, and present their results. I am interested in sketching ideas, developing Human-computer applications, developing multi-sensory interfaces, to evaluating these interfaces.
Example PhD project 1. Smart visualisation. How can AI and smart concepts help to create automatic visualisations? How can AI algorithms help to make smarter interfaces for data-visualisation interaction? How can visualisation design be automated? etc.
Example PhD project 2. Multiple views to the masses. How can we easily create multiple-view interfaces? How can multiple view interfaces be linked across different devices? How can multiplicity, multivocality, and alternative viewpoints be integrated in visualisation? How does alternative viewpoints in visualisation help uncertainty visualisation and visual disambiguation?
Example PhD project 3. Many senses. How can we develop multimodal and multi-sensory information visualisation tools? How can many senses be used together for visualisation? How can we easily manipulate data visualisations through different sensory channels, both input and output?
Example PhD project 4. Multiple heritage models. How can we create multiple heritage models, and store them effectively? How can we automate the creation of heritage models, and integrate them into a virtual museum. Extension of heritagetogether.org project.
Research areas and keywords
Keywords
- QA75 Electronic computers. Computer science - Human Computer Interaction, Data Visualization, Design Sketching, Information Visualization, Scientific Visualization, Data art
Education / academic qualifications
- 2003 - Other , Postgraduate Certificate in Higher Education (1999 - 2003)
- 1996 - PhD , "Aspects of Abstraction in Scientific Visualization" (Doctor of Philosophy in Computer Science) (1992 - 1996)
- 1992 - BSc , Computer Science (1989 - 1992)
Research outputs (126)
- Published
Visualisation Design Ideation with AI: A New Framework, Vocabulary and Tool
Research output: Contribution to journal › Article › peer-review
- E-pub ahead of print
Path-based Design Model for Constructing and Exploring Alternative Visualisations
Research output: Contribution to journal › Article › peer-review
- Published
Towards a Generative AI Design Dialogue
Research output: Chapter in Book/Report/Conference proceeding › Conference contribution › peer-review
Prof. activities and awards (5)
EduVis : Workshop on Visualization Education, Literacy, and Activities
Activity: Participating in or organising an event › Participation in Academic conference
IEEE VIS: Visualization & Visual Analytics
Activity: Participating in or organising an event › Participation in Academic conference
IEEE VIS 2022: Visualization & Visual Analytics
Activity: Participating in or organising an event › Participation in Academic conference
Accolades (3)
Bangor University Teaching Fellowship, 2023
Prize: Other distinction
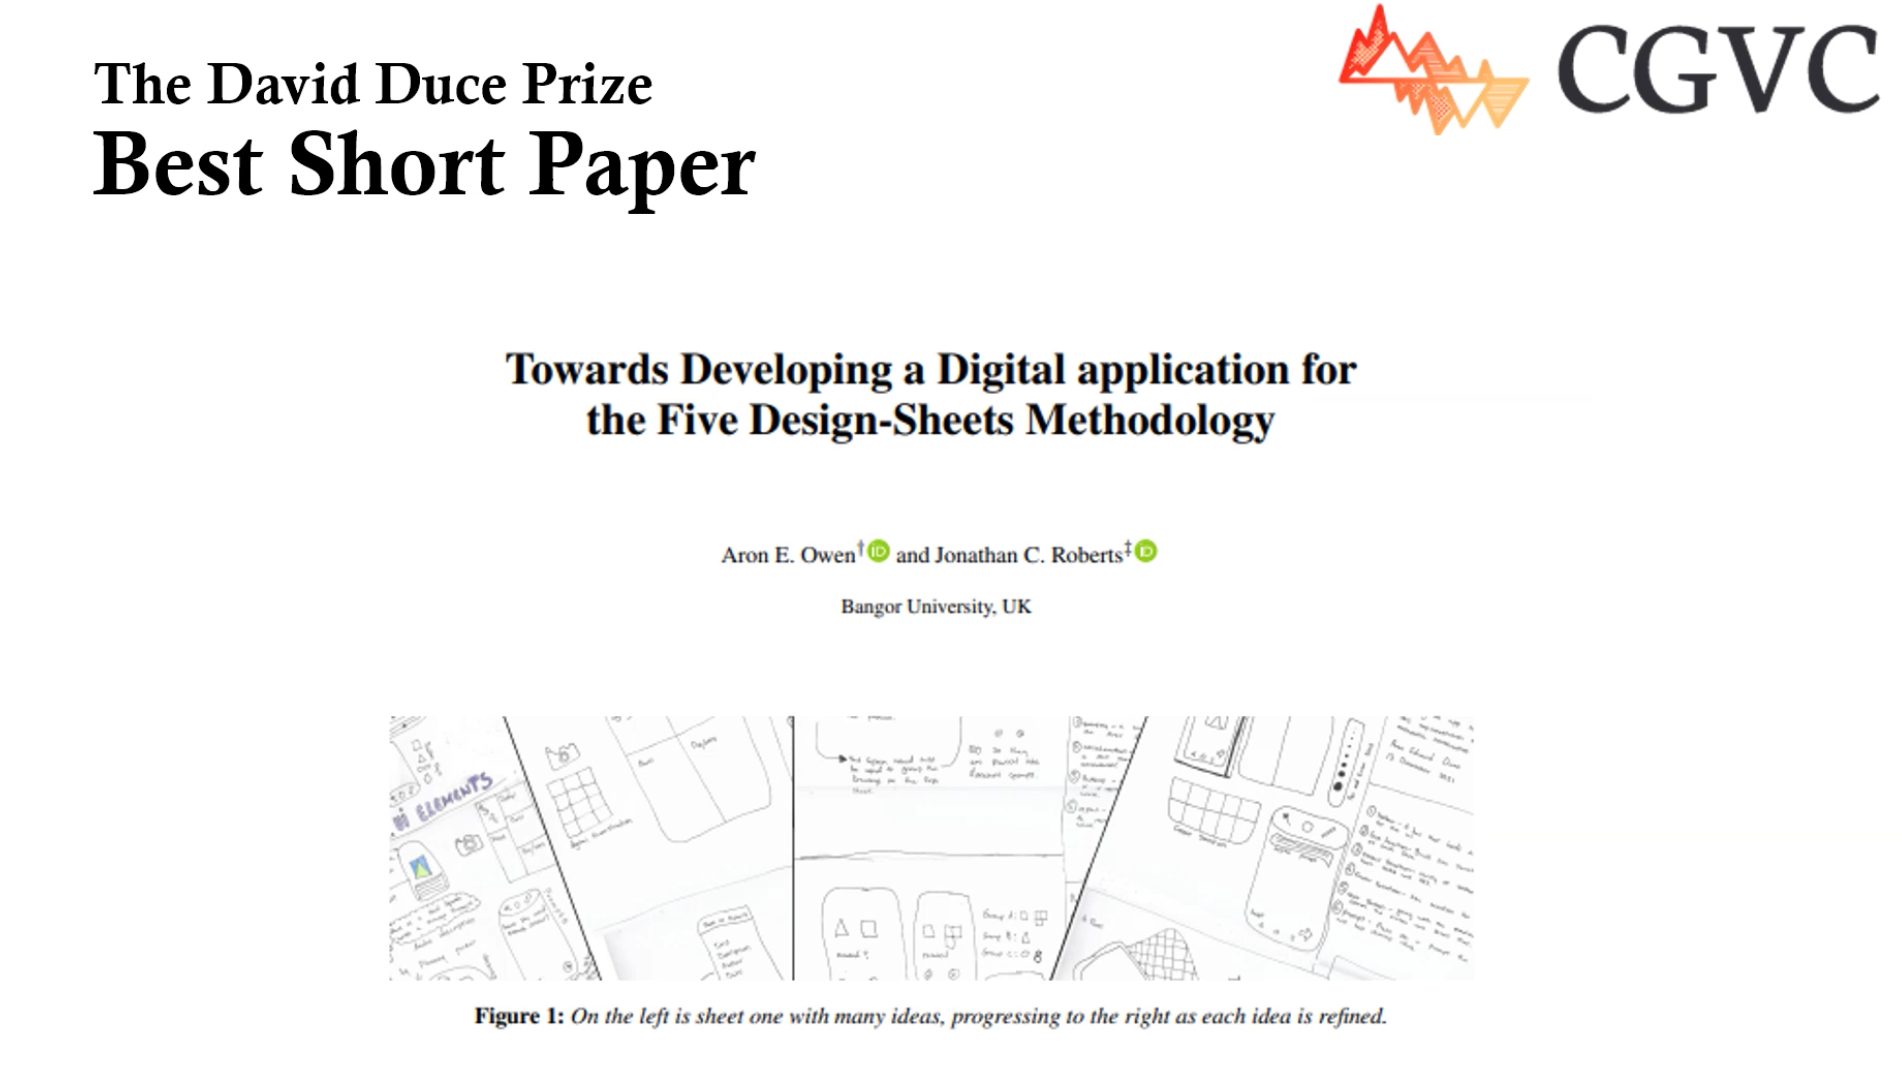
Best Short Paper (the David Duce award) for: Towards Developing a Digital application for the Five Design-Sheets Methodology
Prize: National/international honour
Paper award, full papers honourable mention: Explanatory Journeys
Prize: National/international honour
Projects (17)
Wales Data Nation Sprint Projects
Project: Research
Collocaid: combining learner needs, lexicographic data, text editors
Project: Research