
Explanatory Journeys: Visualising to Understand and Explain Administrative Justice Paths of Redress
Research output: Contribution to journal › Article › peer-review
Electronic versions
Documents
- Artemus_Author_VersionFinal
Accepted author manuscript, 3.42 MB, PDF document
Links
- https://arxiv.org/abs/2107.14013
Submitted manuscript
Licence: CC BY Show licence
DOI
Administrative justice concerns the relationships between individuals and the state. It includes redress and complaints on decisions of a child's education, social care, licensing, planning, environment, housing and homelessness. However, if someone has a complaint or an issue, it is challenging for people to understand different possible redress paths and explore what path is suitable for their situation. Explanatory visualisation has the potential to display these paths of redress in a clear way, such that people can see, understand and explore their options. The visualisation challenge is further complicated because information is spread across many documents, laws, guidance and policies and requires judicial interpretation. Consequently, there is not a single database of paths of redress. In this work we present how we have co-designed a system to visualise administrative justice paths of redress. Simultaneously, we classify, collate and organise the underpinning data, from expert workshops, heuristic evaluation and expert critical reflection. We make four contributions: (i) an application design study of the explanatory visualisation tool (Artemus), (ii) coordinated and co-design approach to aggregating the data, (iii) two in-depth case studies in housing and education demonstrating explanatory paths of redress in administrative law, and (iv) reflections on the expert co-design process and expert data gathering and explanatory visualisation for administrative justice and law.
Keywords
- Explanatory visualisation, law, law visualisation, visualisation, Human computer interaction, Computer science, Administrative Justice, Education law, Housing law, Redress, Software Engineering, Graphics, Data analysis, Five Design-Sheet
| Original language | English |
|---|---|
| Pages (from-to) | 518-528 |
| Number of pages | 11 |
| Journal | IEEE Transactions on visualization and computer graphics |
| Volume | 28 |
| Issue number | 1 |
| Early online date | 29 Sept 2021 |
| DOIs | |
| Publication status | Published - Jan 2022 |
| Event | IEEE VIS 2021: IEEE Visualization 2021 - New Orleans, United States Duration: 24 Oct 2021 → 29 Oct 2021 http://ieeevis.org/year/2021/welcome |
Research outputs (34)
- Accepted/In press
Creating Data Art: Authentic Learning and Visualisation Exhibition
Research output: Contribution to conference › Paper › peer-review
- Published
Reflections and Considerations on Running Creative Visualization Learning Activities
Research output: Chapter in Book/Report/Conference proceeding › Conference contribution › peer-review
- Published
Personalised Authentic assessments with Synchronous Learning Activities: a Framework for Teaching Visualisation and Graphics
Research output: Chapter in Book/Report/Conference proceeding › Conference contribution › peer-review
Accolades (2)
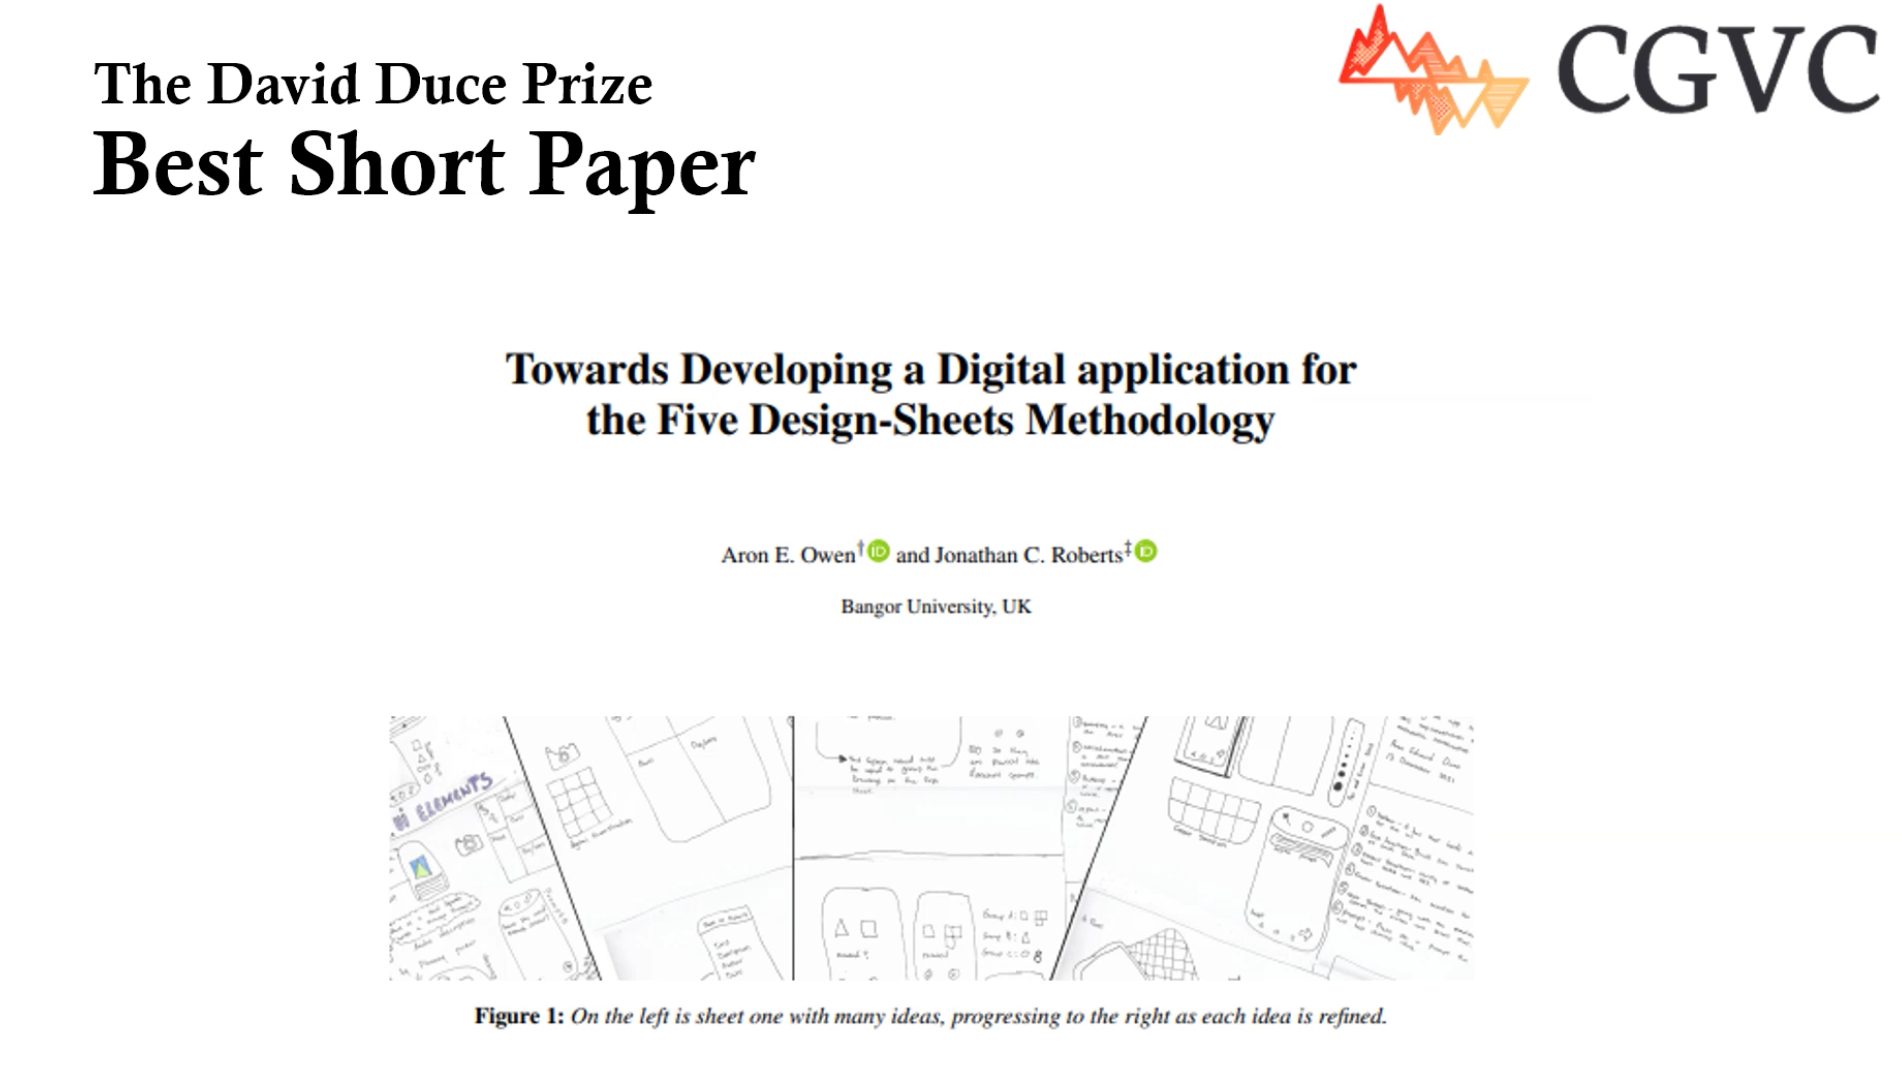
Best Short Paper (the David Duce award) for: Towards Developing a Digital application for the Five Design-Sheets Methodology
Prize: National/international honour
Paper award, full papers honourable mention: Explanatory Journeys
Prize: National/international honour
Total downloads
No data available